Seven NHS trusts in England are already treating more coronavirus patients than they were at the peak of the first wave, statistics show as the country braces for five months of misery through winter.
But the silver lining is that, overall, total beds occupied by Covid-19 sufferers across the country are a third of what they were during the darkest days of the crisis in April.
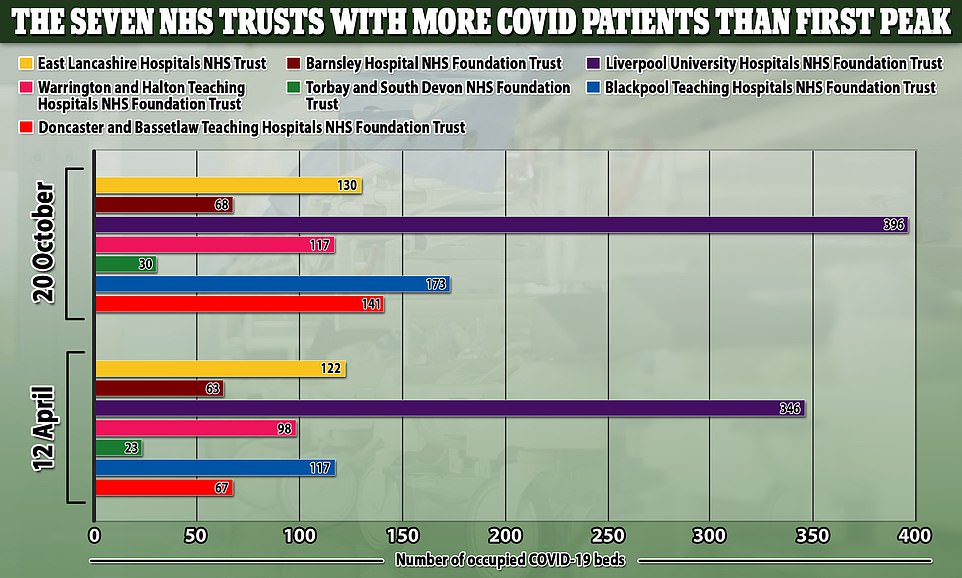
MailOnline’s analysis of official NHS figures reveals the numbers of coronavirus-hospitalised patients in Liverpool, Doncaster, Blackpool, Devon, Warrington, Barnsley and East Lancashire have surpassed levels in the spring.
Doncaster and Bassetlaw Teaching Hospitals NHS Foundation Trust in Yorkshire has seen the most dramatic rise in Covid-19 hospitalisations compared to its first peak. Just 67 beds were occupied by infected patients on April 12 – England’s busiest day in the pandemic. This had more than doubled to 141 by October 20.
At Blackpool Teaching Hospitals NHS Foundation Trust, 173 of its beds were taken up by people with the virus on October 20. It marked a 50 per cent jump compared to levels on April 12, when doctors there were treating 117 Covid-19 patients.
Liverpool University Hospitals NHS Foundation Trust is treating 396 coronavirus sufferers, according to the most recent snapshot from NHS England. This is up almost 15 per cent on the 346 patients being treated for the disease on April 12.
But outbreaks of infections in some of the worst-hit areas of the country – including Liverpool – are already starting to slow down, suggesting the influx of hospital additions will tail off in the coming weeks. It normally takes more than a fortnight to become seriously ill with Covid-19 and need hospital treatment.
SCROLL DOWN TO SEE HOW BUSY YOUR HOSPITAL IS

Seven NHS trusts in England are already treating more coronavirus patients than they were at the peak of the first wave, MailOnline analysis of NHS England figures shows
Warrington and Halton Teaching Hospitals NHS Foundation Trust is currently treating 117 Covid-19 patients now, compared to 98 six months ago.
At Barnsley Hospital NHS Foundation Trust and East Lancashire Hospitals NHS Trust, the number of beds occupied with Covid has risen marginally, from 63 to 68 and 122 to 130, respectively. Torbay and South Devon NHS Foundation Trust has also seen beds occupied by Covid-19 patients increase slightly from 23 to 30 in the same time period.
The caveat with these figures is that they only go up to October 20, meaning there is no way to tell how many patients have been discharged since Wednesday.
And Covid-19 hospital admissions lag by around two to three weeks because of a delay in the time it takes for someone to fall ill enough with the virus to need care – so there is a chance they have continued to rise.
As a result of a late-September surge in infections – which saw at least 28,000 people catching the disease every day – hundreds or thousands of admissions and deaths are ‘baked in’.
The fact several trusts are seeing more Covid-19 patients than in spring already will be a cause for concern so early into winter. As the country moves deeper into the colder months, people tend to get sicker and need care, which puts additional pressure on hospitals.
But there is reason to be optimistic, as the same NHS figures show the number of beds occupied by Covid-19 patients are a third of what they were six months ago. As of October 20, there were just 6,055 people with the disease in the country’s hospital, compared to 18,970 on April 12.
Even at the peak of the first wave, only 27 per cent of England’s hospital beds were occupied by coronavirus patients, on average. It is not possible to compare how many beds are occupied now because health officials have secured additional capacity through deals with the private sector and also in its Nightingale hospitals.
However, the most recently published figures- which only go up up to the end of September – suggested it stood at 2 per cent. At that point, 478 out of 110,000 beds in use were by Covid-19 patients.
As wards start to fill up with virus patients once again, it was announced yesterday the NHS Nightingale Hospital in Manchester will become the first of the seven Nightingales – built during the pandemic in spring – to reopen.
The unit in Manchester will not be used to treat people seriously ill with coronavirus but instead opened to take non-virus patients who may need to be discharged to make room for people with Covid-19.
The other six Nightingales are on standby in case the crisis threatens to overwhelm hospitals in other areas. Health bosses are conscious not to disrupt normal healthcare this time around.
Tens of thousands of operations were cancelled in spring to make way for a swarm of virus patients and almost all NHS services were functioning at a fraction of their normal capacity.
NHS Digital estimates there were 26.7million fewer GP appointments in England between March and August this year than in the same period in 2019 – down from 146.2million to 119.5million.
Cancer Research UK said more than 350,000 people who would normally have been urgently referred to a specialist to have vital tests to check if they have the disease have not been. The charity believes the delays could cause an additional 35,000 avoidable deaths at the hands of cancer.
Inspectors also fear that ‘lost’ appointments with doctors have led to a significant deterioration in patients’ health and the worsening of other conditions such as asthma and diabetes.
It comes as separate data showed the number of people dying of coronavirus in England and Wales rose for the first time in five months in September. But it is still only the 19th most common cause of death.
Office for National Statistics data published today show 725 people died with Covid-19 – although not necessarily because of it. In comparison, just 576 fatalities were recorded in August. This was the first time the number had increased since the first wave of disease slammed into the UK in April, when deaths in England and Wales soared from 1,700 to 31,000 in a month.
Since then, deaths had been more than halving every month but have now started to rise again. But the report reiterated that the number of victims is still ‘significantly below levels’ seen during the spring, when more than 1,000 Covid-19 fatalities were being recorded each day.
Despite coronavirus fatalities increasing, it still no longer ranks as one of the top causes of death. It was the 19th most common in England and 24th in Wales. Dementia was the top cause of death in both England and Wales, accounting for more than one in 10 fatalities, followed by heart disease and lung cancer.
The ONS report comes as official data from the Department of Health also shows deaths are rising again across the UK. The daily average has now risen to 151 after falling to a low of just seven in the summer. Top medical advisers have warned that deaths will continue to rise even if cases start falling because they have been ‘baked in’ among people who have already been infected.
Data in the report also showed that 2,500 more people than usual died in September but, with fewer than 750 blamed on coronavirus, this meant that at least 1,700 were ‘excess’ deaths which are those thought to have been caused by the pandemic but not directly by Covid-19.
A total of 39,827 people died in England in September, which was 2,568 more than usual for that month. In Wales there were 2,610 deaths – 135 more than average.
Coronavirus accounted for fewer than one in 50 of these, composing 1.7 per cent of deaths in England and 1.3 per cent in Wales.
The 725 people who died with coronavirus in England and Wales in September were ones whose deaths ‘involved’ the disease, while a lower 596 people died ‘due to Covid-19’.
Those who had it when they died but it wasn’t deemed to be the main cause of death likely had another illness that coronavirus exacerbated – such as heart disease or cancer – or it may have been coincidental that they tested positive.
The ONS report said: ‘In September 2020, the number of deaths and mortality rate due to Covid-19 remained significantly below levels seen in March 2020 (the first month a Covid-19 death was registered in England and Wales).
‘However, the mortality rate due to Covid-19 was higher in England in September 2020 compared with the previous month (August 2020).
‘The mortality rate due to Covid-19 also increased in Wales, but this was not significant. This is the first increase in the mortality rate for deaths due to Covid-19 from one month to the next since April 2020.’
The rate of deaths involving coronavirus per 100,000 people in September – a standardised measure – was 12.6 in England and 10.8 in Wales. This was significantly lower than the 647 and 498 per 100,000, respectively, in April.
It was also significantly lower than the death rate for other illnesses.
The leading cause of death in England in September was dementia, which had a death rate of 97.9 per 100,000 – six times higher than that of Covid-19.
Heart disease was the second most deadly illness during the most recent month, with a rate of 91.1 per 100,000.
The other biggest killers were lung cancer, brain diseases, chronic lung disease, bowel cancer, flu and pneumonia, ‘ill-defined conditions’ and cancers of the prostate and lymphatic system.
The ONS said it would not publicise a full list that stretches down to the 19th and 24th places that Covid-19 now occupies.
Although coronavirus deaths are far lower than they were during the first wave, they will continue to rise in the weeks and months to come, Government advisers have warned.
Because so many people have been catching the virus in September and October – at least 28,000 people per day, by the ONS’s own estimates – hundreds or thousands of deaths will now follow as a consequence.
| AREA | COVID BEDS APRIL 12 | TOTAL BEDS APRIL 12 | % OCCUPIED AT PEAK | COVID BEDS OCTOBER 20 | RATE COMPARED TO PEAK? |
|---|---|---|---|---|---|
| ENGLAND | 18,970 | 70,558 | 26.89% | 6,055 | 31.92% |
| East of England | 1,679 | 7,557 | 22.22% | 288 | 17.15% |
| London | 4,927 | 12,469 | 39.51% | 610 | 12.38% |
| Midlands | 3,430 | 14,996 | 22.87% | 1,085 | 31.63% |
| North East and Yorkshire | 2,541 | 9,986 | 25.45% | 1,433 | 56.40% |
| North West | 3,014 | 9,885 | 30.49% | 2,097 | 69.58% |
| South East | 2,342 | 9,559 | 24.50% | 325 | 13.88% |
| South West | 1,037 | 6,106 | 16.98% | 217 | 20.93% |
| Essex Partnership University NHS Foundation Trust | 34 | 445 | 7.64% | 3 | 8.82% |
| Mid and South Essex NHS Foundation Trust | 374 | 829 | 45.11% | 80 | 21.39% |
| Bedfordshire Hospitals NHS Foundation Trust | 180 | 684 | 26.32% | 33 | 18.33% |
| The Queen Elizabeth Hospital, King’s Lynn, NHS Foundation Trust | 51 | 259 | 19.69% | 14 | 27.45% |
| Milton Keynes University Hospital NHS Foundation Trust | 66 | 177 | 37.29% | 5 | 7.58% |
| East Suffolk and North Essex NHS Foundation Trust | 123 | 828 | 14.86% | 38 | 30.89% |
| Royal Papworth Hospital NHS Foundation Trust | 49 | 155 | 31.61% | 5 | 10.20% |
| North West Anglia NHS Foundation Trust | 78 | 482 | 16.18% | 23 | 29.49% |
| James Paget University Hospitals NHS Foundation Trust | 74 | 214 | 34.58% | 12 | 16.22% |
| West Suffolk NHS Foundation Trust | 36 | 201 | 17.91% | 7 | 19.44% |
| Cambridge University Hospitals NHS Foundation Trust | 122 | 525 | 23.24% | 9 | 7.38% |
| Norfolk and Norwich University Hospitals NHS Foundation Trust | 77 | 555 | 13.87% | 9 | 11.69% |
| Norfolk and Suffolk NHS Foundation Trust | 16 | 312 | 5.13% | 1 | 6.25% |
| The Princess Alexandra Hospital NHS Trust | 109 | 273 | 39.93% | 6 | 5.50% |
| West Hertfordshire Hospitals NHS Trust | 129 | 328 | 39.33% | 26 | 20.16% |
| East and North Hertfordshire NHS Trust | 65 | 388 | 16.75% | 13 | 20.00% |
| Hertfordshire Partnership University NHS Foundation Trust | 14 | 362 | 3.87% | 0 | 0.00% |
| Norfolk Community Health and Care NHS Trust | 16 | 178 | 8.99% | 3 | 18.75% |
| Hertfordshire Community NHS Trust | 16 | 86 | 18.60% | 1 | 6.25% |
| Barts Health NHS Trust | 559 | 1,196 | 46.74% | 70 | 12.52% |
| London North West University Healthcare NHS Trust | 357 | 771 | 46.30% | 54 | 15.13% |
| Royal Free London NHS Foundation Trust | 410 | 743 | 55.18% | 27 | 6.59% |
| North Middlesex University Hospital NHS Trust | 226 | 418 | 54.07% | 49 | 21.68% |
| The Hillingdon Hospitals NHS Foundation Trust | 102 | 277 | 36.82% | 20 | 19.61% |
| North East London NHS Foundation Trust | 49 | 281 | 17.44% | 16 | 32.65% |
| Kingston Hospital NHS Foundation Trust | 101 | 223 | 45.29% | 8 | 7.92% |
| Barking, Havering and Redbridge University Hospitals NHS Trust | 171 | 815 | 20.98% | 100 | 58.48% |
| Guy’s and St Thomas’ NHS Foundation Trust | 303 | 699 | 43.35% | 18 | 5.94% |
| Lewisham and Greenwich NHS Trust | 286 | 764 | 37.43% | 23 | 8.04% |
| Croydon Health Services NHS Trust | 153 | 352 | 43.47% | 11 | 7.19% |
| St George’s University Hospitals NHS Foundation Trust | 219 | 469 | 46.70% | 9 | 4.11% |
| King’s College Hospital NHS Foundation Trust | 509 | 154 | 330.52% | 43 | 8.45% |
| Whittington Health NHS Trust | 83 | 184 | 45.11% | 20 | 24.10% |
| West London NHS Trust | 32 | 419 | 7.64% | 6 | 18.75% |
| Oxleas NHS Foundation Trust | 22 | 323 | 6.81% | 0 | 0.00% |
| The Royal Marsden NHS Foundation Trust | 10 | 116 | 8.62% | 0 | 0.00% |
| Chelsea and Westminster Hospital NHS Foundation Trust | 243 | 457 | 53.17% | 28 | 11.52% |
| Homerton University Hospital NHS Foundation Trust | 90 | 193 | 46.63% | 7 | 7.78% |
| Barnet, Enfield and Haringey Mental Health NHS Trust | 19 | 490 | 3.88% | 0.00% | |
| University College London Hospitals NHS Foundation Trust | 160 | 367 | 43.60% | 16 | 10.00% |
| Royal Brompton & Harefield NHS Foundation Trust | 96 | 157 | 61.15% | 10 | 10.42% |
| Central and North West London NHS Foundation Trust | 37 | 603 | 6.14% | 3 | 8.11% |
| Epsom and St Helier University Hospitals NHS Trust | 148 | 468 | 31.62% | 33 | 22.30% |
| East London NHS Foundation Trust | 73 | 665 | 10.98% | 13 | 17.81% |
| Hounslow and Richmond Community Healthcare NHS Trust | 18 | 18 | 100.00% | 0 | 0.00% |
| Imperial College Healthcare NHS Trust | 334 | 130 | 256.92% | 19 | 5.69% |
| Central London Community Healthcare NHS Trust | 44 | 161 | 27.33% | 3 | 6.82% |
| Camden and Islington NHS Foundation Trust | 20 | 136 | 14.71% | 0 | 0.00% |
| Worcestershire Health and Care NHS Trust | 37 | 224 | 16.52% | 9 | 24.32% |
| Shropshire Community Health NHS Trust | 16 | 65 | 24.62% | 3 | 18.75% |
| Walsall Healthcare NHS Trust | 180 | 367 | 49.05% | 48 | 26.67% |
| Chesterfield Royal Hospital NHS Foundation Trust | 65 | 270 | 24.07% | 25 | 38.46% |
| Nottinghamshire Healthcare NHS Foundation Trust | 18 | 354 | 5.08% | 4 | 22.22% |
| South Warwickshire NHS Foundation Trust | 75 | 313 | 23.96% | 14 | 18.67% |
| University Hospitals of North Midlands NHS Trust | 134 | 843 | 15.90% | 95 | 70.90% |
| Sherwood Forest Hospitals NHS Foundation Trust | 53 | 287 | 18.47% | 35 | 66.04% |
| University Hospitals Coventry and Warwickshire NHS Trust | 142 | 693 | 20.49% | 23 | 16.20% |
| The Royal Wolverhampton NHS Trust | 228 | 401 | 56.86% | 35 | 15.35% |
| Wye Valley NHS Trust | 31 | 171 | 18.13% | 19 | 61.29% |
| George Eliot Hospital NHS Trust | 69 | 216 | 31.94% | 7 | 10.14% |
| North Staffordshire Combined Healthcare NHS Trust | 11 | 109 | 10.09% | 1 | 9.09% |
| The Dudley Group NHS Foundation Trust | 122 | 467 | 26.12% | 34 | 27.87% |
| Kettering General Hospital NHS Foundation Trust | 69 | 421 | 16.39% | 18 | 26.09% |
| Northampton General Hospital NHS Trust | 104 | 489 | 21.27% | 16 | 15.38% |
| Northamptonshire Healthcare NHS Foundation Trust | 14 | 249 | 5.62% | 0 | 0.00% |
| Midlands Partnership NHS Foundation Trust | 28 | 345 | 8.12% | 4 | 14.29% |
| University Hospitals Birmingham NHS Foundation Trust | 694 | 1,731 | 40.09% | 173 | 24.93% |
| Leicestershire Partnership NHS Trust | 31 | 355 | 8.73% | 1 | 3.23% |
| University Hospitals of Derby and Burton NHS Foundation Trust | 225 | 794 | 28.34% | 98 | 43.56% |
| United Lincolnshire Hospitals NHS Trust | 72 | 435 | 16.55% | 32 | 44.44% |
| University Hospitals of Leicester NHS Trust | 195 | 931 | 20.95% | 58 | 29.74% |
| Worcestershire Acute Hospitals NHS Trust | 128 | 518 | 24.71% | 24 | 18.75% |
| Nottingham University Hospitals NHS Trust | 210 | 839 | 25.03% | 194 | 92.38% |
| Sandwell and West Birmingham Hospitals NHS Trust | 214 | 488 | 43.85% | 51 | 23.83% |
| Birmingham and Solihull Mental Health NHS Foundation Trust | 16 | 595 | 2.69% | 9 | 56.25% |
| Shrewsbury and Telford Hospital NHS Trust | 77 | 312 | 24.68% | 27 | 35.06% |
| Lincolnshire Community Health Services NHS Trust | 16 | 112 | 14.29% | 0 | 0.00% |
| Derbyshire Community Health Services NHS Foundation Trust | 13 | 88 | 14.77% | 1 | 7.69% |
| Coventry and Warwickshire Partnership NHS Trust | 19 | 249 | 7.63% | 8 | 42.11% |
| Birmingham Community Healthcare NHS Foundation Trust | 53 | 257 | 20.62% | 18 | 33.96% |
| Black Country Healthcare NHS Foundation Trust | 16 | 212 | 7.55% | 0 | 0.00% |
| South Tyneside and Sunderland NHS Foundation Trust | 200 | 519 | 38.54% | 108 | 54.00% |
| Bradford Teaching Hospitals NHS Foundation Trust | 88 | 356 | 24.72% | 88 | 100.00% |
| York Teaching Hospital NHS Foundation Trust | 108 | 351 | 30.77% | 31 | 28.70% |
| Harrogate and District NHS Foundation Trust | 34 | 130 | 26.15% | 13 | 38.24% |
| Airedale NHS Foundation Trust | 58 | 172 | 33.72% | 22 | 37.93% |
| Barnsley Hospital NHS Foundation Trust | 63 | 263 | 23.95% | 68 | 107.94% |
| The Rotherham NHS Foundation Trust | 70 | 10 | 700.00% | 58 | 82.86% |
| Sheffield Teaching Hospitals NHS Foundation Trust | 261 | 977 | 26.71% | 147 | 56.32% |
| Northern Lincolnshire and Goole NHS Foundation Trust | 70 | 24 | 291.67% | 41 | 58.57% |
| North Cumbria Integrated Care NHS Foundation Trust | 152 | 350 | 43.43% | 26 | 17.11% |
| Doncaster and Bassetlaw Teaching Hospitals NHS Foundation Trust | 67 | 415 | 16.14% | 141 | 210.45% |
| Gateshead Health NHS Foundation Trust | 114 | 282 | 40.43% | 70 | 61.40% |
| Leeds Teaching Hospitals NHS Trust | 230 | 76 | 302.63% | 143 | 62.17% |
| The Newcastle Upon Tyne Hospitals NHS Foundation Trust | 141 | 641 | 22.00% | 58 | 41.13% |
| Northumbria Healthcare NHS Foundation Trust | 134 | 462 | 29.00% | 54 | 40.30% |
| South Tees Hospitals NHS Foundation Trust | 145 | 173 | 83.82% | 50 | 34.48% |
| North Tees and Hartlepool NHS Foundation Trust | 73 | 234 | 31.20% | 68 | 93.15% |
| Hull University Teaching Hospitals NHS Trust | 44 | 554 | 7.94% | 22 | 50.00% |
| Calderdale and Huddersfield NHS Foundation Trust | 93 | 308 | 30.19% | 50 | 53.76% |
| Cumbria, Northumberland, Tyne and Wear NHS Foundation Trust | 43 | 634 | 6.78% | 9 | 20.93% |
| Mid Yorkshire Hospitals NHS Trust | 165 | 484 | 34.09% | 91 | 55.15% |
| County Durham and Darlington NHS Foundation Trust | 129 | 468 | 27.56% | 52 | 40.31% |
| Bradford District Care NHS Foundation Trust | 12 | 153 | 7.84% | 0 | 0.00% |
| Manchester University NHS Foundation Trust | 414 | 471 | 87.90% | 157 | 37.92% |
| Wirral University Teaching Hospital NHS Foundation Trust | 128 | 397 | 32.24% | 87 | 67.97% |
| St Helens and Knowsley Teaching Hospitals NHS Trust | 153 | 454 | 33.70% | 126 | 82.35% |
| Liverpool Heart and Chest Hospital NHS Foundation Trust | 22 | 53 | 41.51% | 7 | 31.82% |
| Alder Hey Children’s NHS Foundation Trust | 11 | 90 | 12.22% | 3 | 27.27% |
| Mid Cheshire Hospitals NHS Foundation Trust | 85 | 309 | 27.51% | 22 | 25.88% |
| Liverpool University Hospitals NHS Foundation Trust | 346 | 969 | 35.71% | 396 | 114.45% |
| The Walton Centre NHS Foundation Trust | 29 | 84 | 34.52% | 1 | 3.45% |
| East Cheshire NHS Trust | 57 | 190 | 30.00% | 15 | 26.32% |
| Countess of Chester Hospital NHS Foundation Trust | 120 | 307 | 39.09% | 26 | 21.67% |
| Salford Royal NHS Foundation Trust | 136 | 101 | 134.65% | 73 | 53.68% |
| Bolton NHS Foundation Trust | 141 | 344 | 40.99% | 54 | 38.30% |
| Tameside and Glossop Integrated Care NHS Foundation Trust | 74 | 242 | 30.58% | 47 | 63.51% |
| Wrightington, Wigan and Leigh NHS Foundation Trust | 93 | 258 | 36.05% | 91 | 97.85% |
| Pennine Care NHS Foundation Trust | 31 | 416 | 7.45% | 4 | 12.90% |
| North West Boroughs Healthcare NHS Foundation Trust | 25 | 190 | 13.16% | 5 | 20.00% |
| University Hospitals of Morecambe Bay NHS Foundation Trust | 130 | 332 | 39.16% | 92 | 70.77% |
| Southport and Ormskirk Hospital NHS Trust | 104 | 336 | 30.95% | 71 | 68.27% |
| Lancashire & South Cumbria NHS Foundation Trust | 19 | 310 | 6.13% | 7 | 36.84% |
| Pennine Acute Hospitals NHS Trust | 259 | 207 | 125.12% | 183 | 70.66% |
| Stockport NHS Foundation Trust | 117 | 374 | 31.28% | 69 | 58.97% |
| Warrington and Halton Teaching Hospitals NHS Foundation Trust | 98 | 301 | 32.56% | 117 | 119.39% |
| Cheshire and Wirral Partnership NHS Foundation Trust | 11 | 218 | 5.05% | 0 | 0.00% |
| Blackpool Teaching Hospitals NHS Foundation Trust | 117 | 438 | 26.71% | 173 | 147.86% |
| Lancashire Teaching Hospitals NHS Foundation Trust | 132 | 447 | 29.53% | 110 | 83.33% |
| East Lancashire Hospitals NHS Trust | 122 | 482 | 25.31% | 130 | 106.56% |
| Greater Manchester Mental Health NHS Foundation Trust | 18 | 796 | 2.26% | 9 | 50.00% |
| Isle of Wight NHS Trust | 19 | 20 | 95.00% | 2 | 10.53% |
| Royal Surrey County Hospital NHS Foundation Trust | 63 | 207 | 30.43% | 18 | 28.57% |
| Sussex Community NHS Foundation Trust | 47 | 250 | 18.80% | 0 | 0.00% |
| Frimley Health NHS Foundation Trust | 276 | 696 | 39.66% | 62 | 22.46% |
| University Hospital Southampton NHS Foundation Trust | 166 | 718 | 23.12% | 25 | 15.06% |
| Portsmouth Hospitals NHS Trust | 130 | 614 | 21.17% | 17 | 13.08% |
| Royal Berkshire NHS Foundation Trust | 142 | 491 | 28.92% | 31 | 21.83% |
| Hampshire Hospitals NHS Foundation Trust | 139 | 418 | 33.25% | 35 | 25.18% |
| Dartford and Gravesham NHS Trust | 79 | 289 | 27.34% | 12 | 15.19% |
| Oxford Health NHS Foundation Trust | 55 | 400 | 13.75% | 0 | 0.00% |
| Medway NHS Foundation Trust | 106 | 316 | 33.54% | 25 | 23.58% |
| Oxford University Hospitals NHS Foundation Trust | 125 | 578 | 21.63% | 16 | 12.80% |
| Ashford and St Peter’s Hospitals NHS Foundation Trust | 114 | 285 | 40.00% | 30 | 26.32% |
| Surrey and Sussex Healthcare NHS Trust | 128 | 351 | 36.47% | 6 | 4.69% |
| East Kent Hospitals University NHS Foundation Trust | 143 | 508 | 28.15% | 8 | 5.59% |
| Southern Health NHS Foundation Trust | 49 | 457 | 10.72% | 3 | 6.12% |
| Maidstone and Tunbridge Wells NHS Trust | 85 | 191 | 44.50% | 2 | 2.35% |
| Berkshire Healthcare NHS Foundation Trust | 48 | 196 | 24.49% | 3 | 6.25% |
| Sussex Partnership NHS Foundation Trust | 13 | 8 | 162.50% | 0 | 0.00% |
| East Sussex Healthcare NHS Trust | 68 | 350 | 19.43% | 7 | 10.29% |
| Brighton and Sussex University Hospitals NHS Trust | 107 | 525 | 20.38% | 15 | 14.02% |
| Buckinghamshire Healthcare NHS Trust | 86 | 316 | 27.22% | 4 | 4.65% |
| Kent and Medway NHS and Social Care Partnership Trust | 12 | 353 | 3.40% | 0 | 0.00% |
| Western Sussex Hospitals NHS Foundation Trust | 77 | 501 | 15.37% | 4 | 5.19% |
| Kent Community Health NHS Foundation Trust | 38 | 303 | 12.54% | 0 | 0.00% |
| Yeovil District Hospital NHS Foundation Trust | 14 | 148 | 9.46% | 1 | 7.14% |
| University Hospitals Bristol and Weston NHS Foundation Trust | 81 | 361 | 22.44% | 15 | 18.52% |
| Torbay and South Devon NHS Foundation Trust | 23 | 195 | 11.79% | 30 | 130.43% |
| Dorset County Hospital NHS Foundation Trust | 17 | 191 | 8.90% | 4 | 23.53% |
| Northern Devon Healthcare NHS Trust | 15 | 143 | 10.49% | 7 | 46.67% |
| Royal United Hospitals Bath NHS Foundation Trust | 43 | 257 | 16.73% | 6 | 13.95% |
| Dorset Healthcare University NHS Foundation Trust | 29 | 277 | 10.47% | 5 | 17.24% |
| Royal Cornwall Hospitals NHS Trust | 32 | 233 | 13.73% | 3 | 9.38% |
| Somerset NHS Foundation Trust | 32 | 444 | 7.21% | 6 | 18.75% |
| Royal Devon and Exeter NHS Foundation Trust | 54 | 330 | 16.36% | 14 | 25.93% |
| Cornwall Partnership NHS Foundation Trust | 50 | 252 | 19.84% | 1 | 2.00% |
| University Hospitals Plymouth NHS Trust | 89 | 404 | 22.03% | 22 | 24.72% |
| Great Western Hospitals NHS Foundation Trust | 64 | 273 | 23.44% | 16 | 25.00% |
| Salisbury NHS Foundation Trust | 38 | 184 | 20.65% | 2 | 5.26% |
| University Hospitals Dorset NHS Foundation Trust | 76 | 476 | 15.97% | 35 | 46.05% |
| Gloucestershire Hospitals NHS Foundation Trust | 148 | 262 | 56.49% | 15 | 10.14% |
| Gloucestershire Health and Care NHS Foundation Trust | 78 | 230 | 33.91% | 0 | 0.00% |
| North Bristol NHS Trust | 107 | 620 | 17.26% | 33 | 30.84% |
| Avon and Wiltshire Mental Health Partnership NHS Trust | 19 | 346 | 5.49% | 2 | 10.53% |